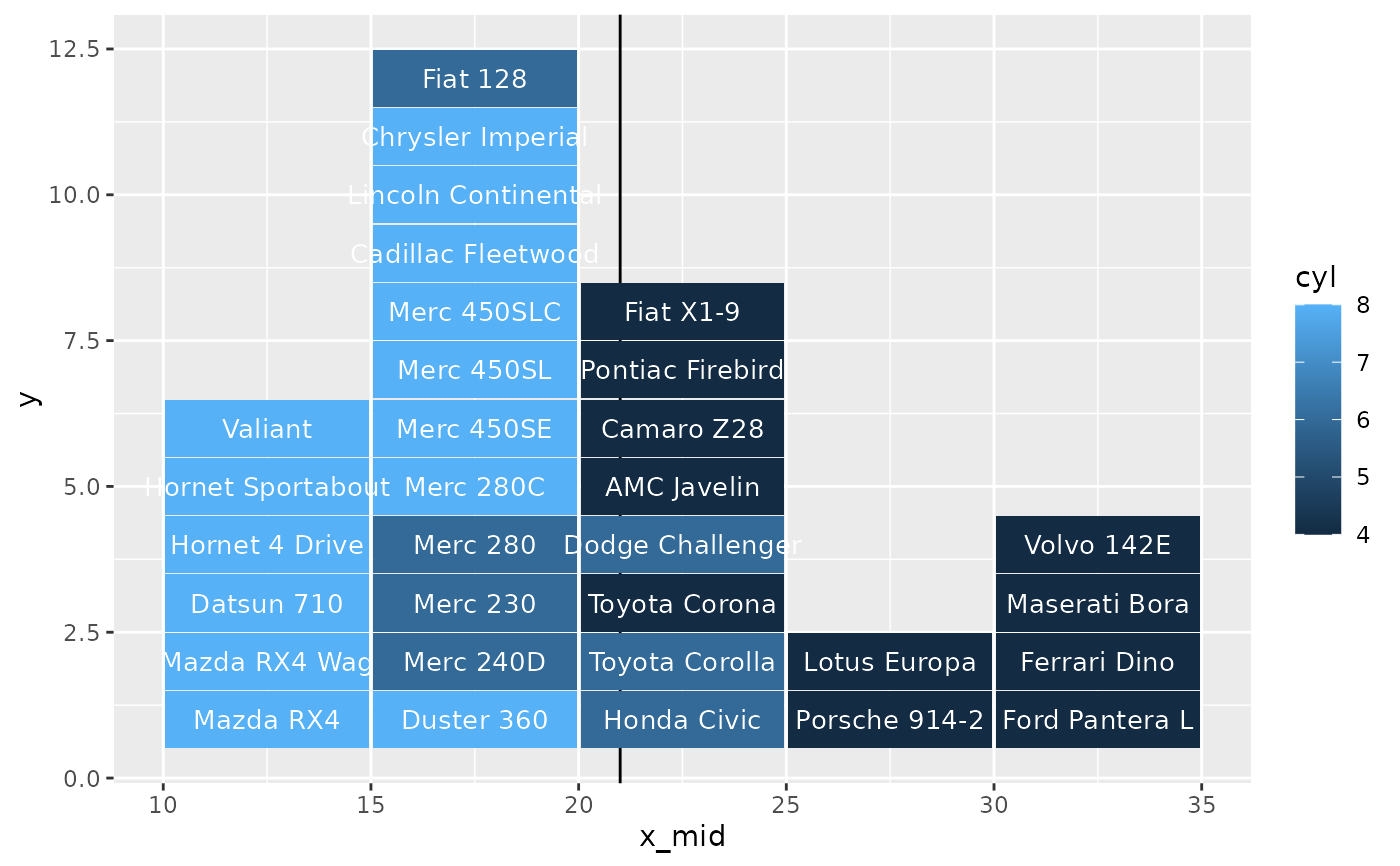
Add columns to a dataframe that allows building a discrete histogram. Each row will recieve a bin, bin center value, and y position. While the bin center values directly correspond to a value in the "val" unit, the y axis represents a stacking of all rows in that bin. This is designed for creating discrete histograms where each observation is a point, rather than part of a distribution.
discrete_histogram(
  data,
  val_col,
  group_cols = NULL,
  breaks = "fd",
  y_margin = 2,
  x_margin = 2
)